See your students more clearly
Ninety days. Two 25-minute assessments. Your students, your classrooms, your data
The Student Success System begins with visibility. The Visibility Pilot gives your school a clearer picture of your students and how their learning changes over the next ninety days.
WHAT IT REVEALS
A clearer view of your students
A starting point for every student
Results are available as soon as students complete the assessment. Teachers can review percentile and scale scores, results by domain, and the areas in which additional information may be useful.
The range inside each classroom
Results show the range of learning within a classroom, grade, or division on a common scale, including students working above and below the level of the curriculum.
Students worth a closer look
Results can add another piece of evidence when a student performs differently than expected or when a teacher already has a question they want to examine more closely.
Students working above grade level
The same assessment that identifies students working below grade level also identifies students working substantially above it, giving schools a common measure across the full range.
What’s actually behind a score
Click into any student’s assessment and you can see all thirty questions — how far the test adapted, where the student was successful, how long they spent, and what they skipped.
How your students engage with assessment
Testing behavior helps educators judge what a score actually means.
A low result may suggest a learning need, but a closer look can reveal that the student moved rapidly through the assessment, skipped substantial parts of it, or spent very little time engaging with the questions.
In that case, the immediate question may not be a foundational skill gap at all. It may be an engagement, attention, stamina, or assessment-condition question.
Looking at the behavior behind the score helps educators avoid designing an intervention for the wrong problem.
A Progress Rate for every student
After the second assessment, each student has a Progress Rate showing their progress over the ninety days relative to the expected rate. Progress Rates can also be reviewed by classroom, grade, and across the participating cohort.
The two administrations show how each student’s learning changed over the pilot period and allow the school to return to questions raised by the first assessment.
If teaching, intervention, challenge, or other conditions changed after the first assessment, the second provides another piece of evidence about what followed.
It does not by itself establish what caused the change, but it helps the school decide what to sustain, investigate, or reconsider.
WHAT IT IS
The pilot at a glance
Ninety days, inside a single term
The pilot begins and ends within a single school term.
There is no fee
The Visibility Pilot is offered at no cost. Schools decide what comes next only after seeing their own students in their own data.
It fits your calendar
Each assessment takes about 25 minutes and fits inside a normal class period.
You choose the scale
A pilot can include a classroom, grade, division, or larger cohort. We’ll explain what each option can reasonably show and what it cannot. A smaller pilot is useful for experiencing the assessments, reports, and workflow. Including a full grade or division also allows you to see the range of learning across classrooms.
It runs alongside what you already have
Schools can continue using ERB, DIBELS, curriculum assessments, and other existing measures throughout the pilot. This gives your team the opportunity to evaluate True Progress alongside the information you already use.
Your school controls the communication
Your school decides what is shared, with whom, and when, including communication with families. We can share examples of how other independent schools have handled those conversations and help your team prepare language if useful.
THE SEQUENCE
How the Pilot Works
- 01
Design your workflow
Before testing begins, we work with you to define what different findings will trigger: when a result should be reviewed more closely, who takes that next step, when the Diagnostic or Inventory may help, and how your color bands should be calibrated for your school.
A score can trigger a known next action without automatically determining what the student needs. The result is a shared workflow for moving from evidence to closer inquiry while preserving educator judgment.
- 02
Prepare your faculty
A 45-minute Zoom prepares every teacher who will administer the assessment: how students sign in, how to proctor, how to support students appropriately, and how to see results.
The pilot is also an opportunity for faculty to evaluate True Progress. We ask teachers whether the assessment results add useful information, whether the reports are useful in their work, and what they would change.
- 03
The first assessment window
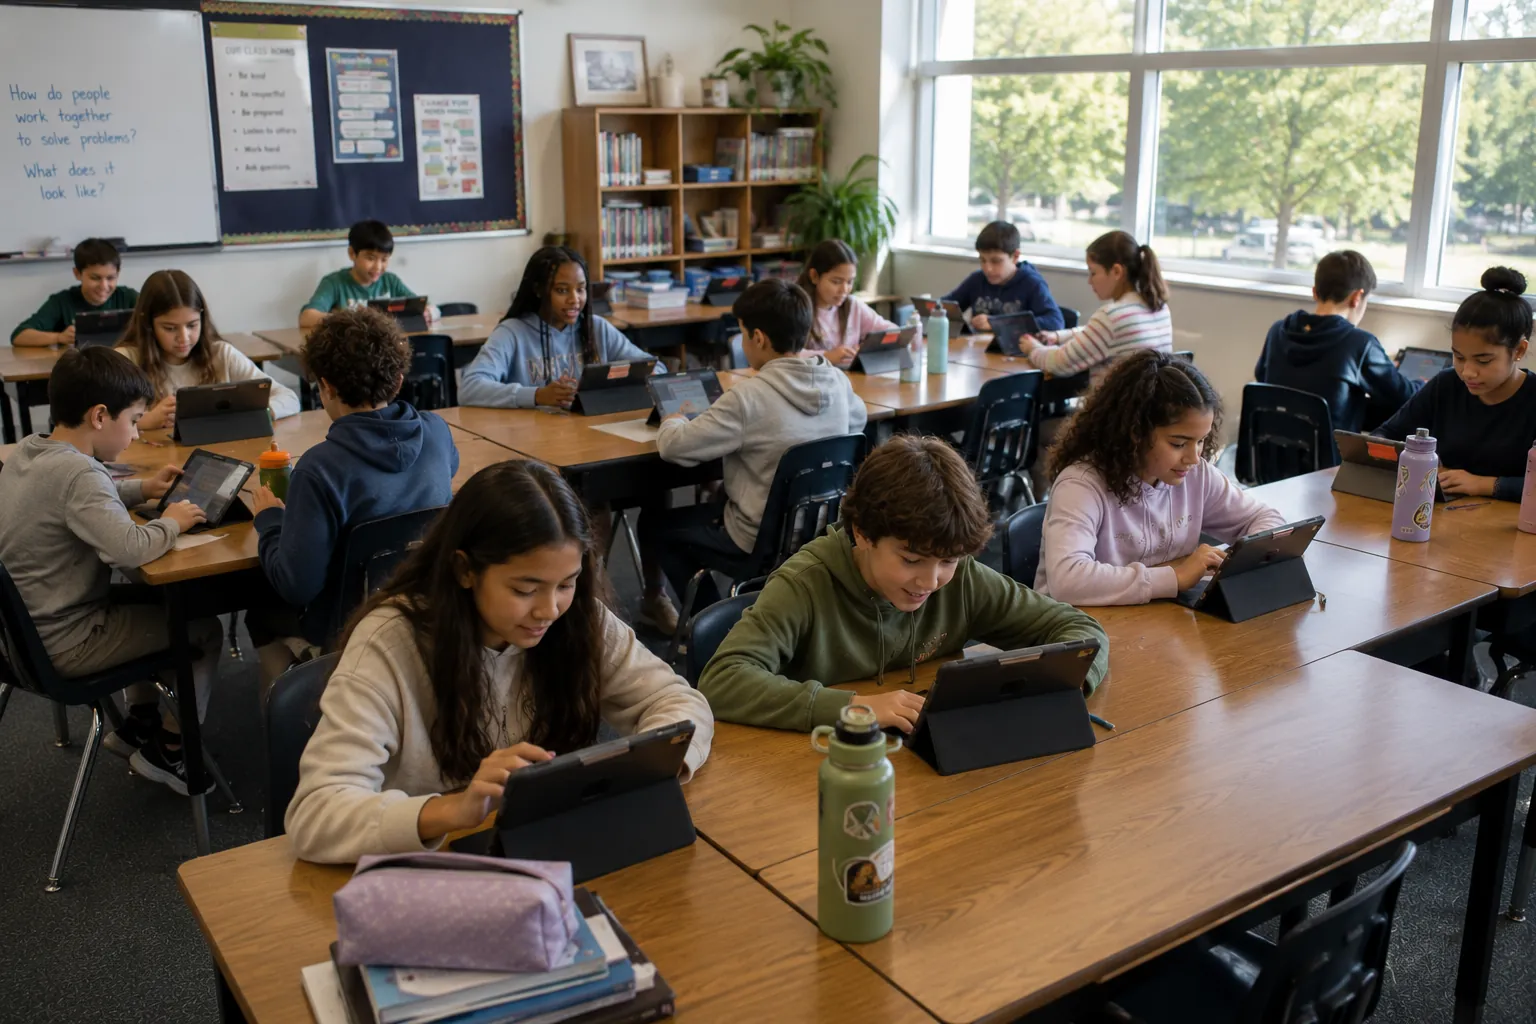
Students test during a normal class period — about 25 minutes. Results are immediate.
This first administration establishes the baseline used for the pilot.
The first administration is deliberately low-stakes. Especially with younger students, we’ll help your team distinguish the data worth acting on from the data worth holding loosely.
- 04
Read the data together
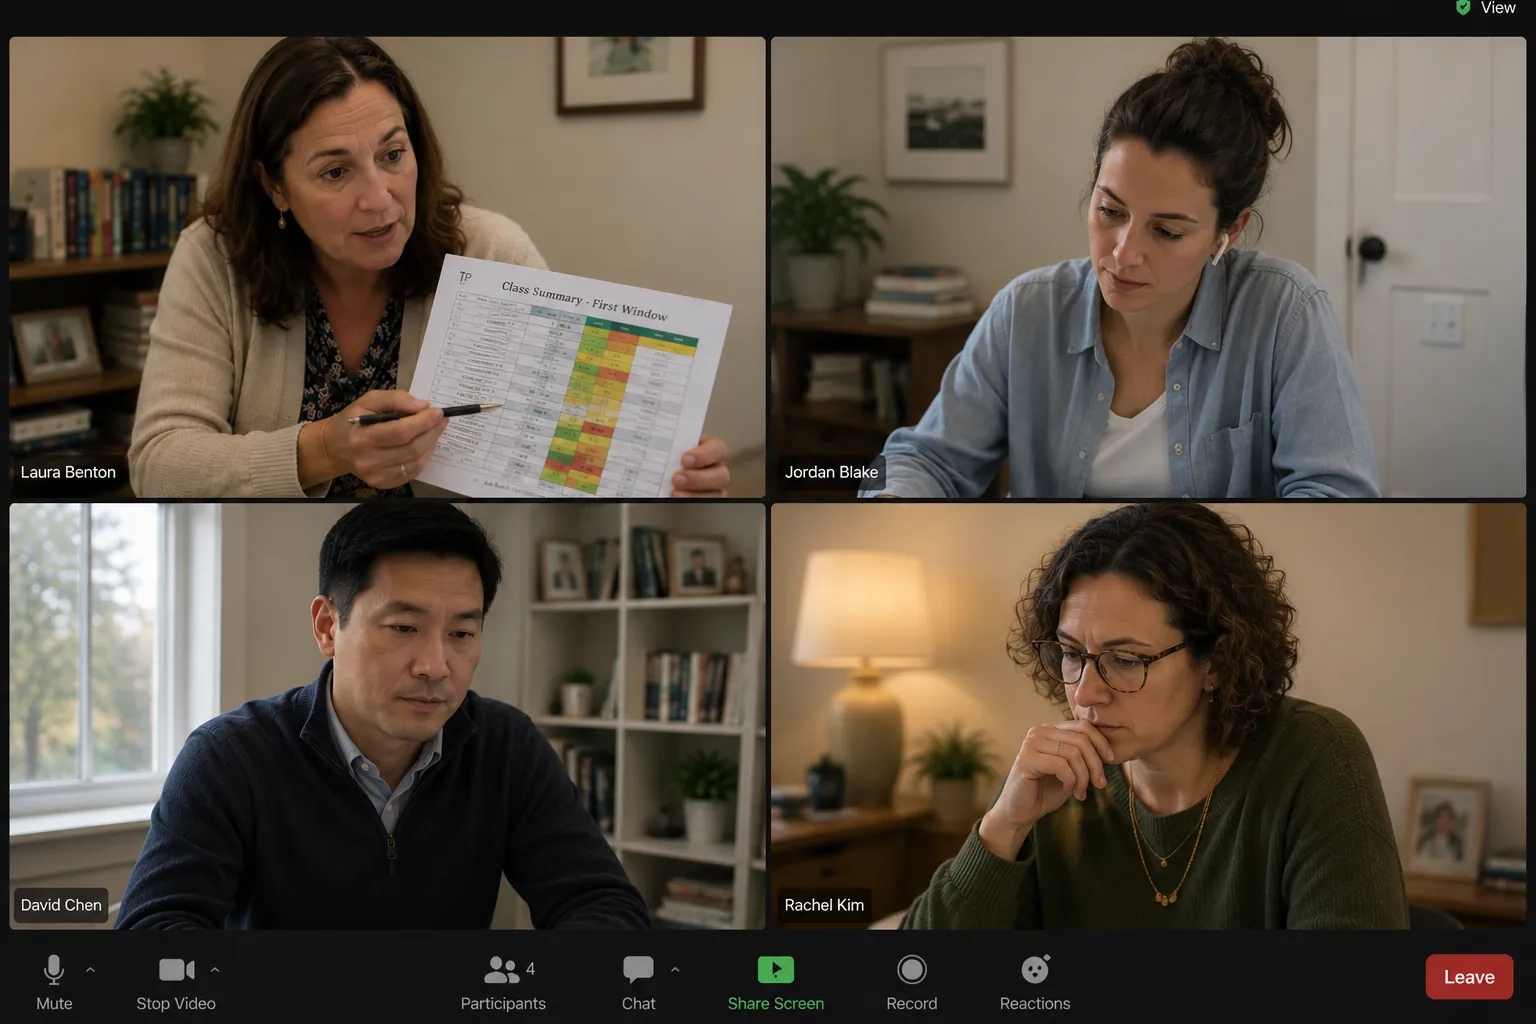
Once students have tested, we meet with your faculty for 45 minutes using your own student data.
We review how the scores are calculated, what the reports show, and which patterns may warrant closer inquiry or additional assessment.
We help teachers distinguish findings that deserve attention from results that should be interpreted cautiously, held loosely, or explored further. That includes looking behind a score at item responses, timing, skipped questions, and other evidence that may change the interpretation.
Each session is designed to strengthen professional judgment.
- 05
Go deeper where it matters
Use the Diagnostic where you need to understand what a student specifically needs, and the Inventory when a student’s profile does not fit neatly within a single grade level.
Use as much or as little as is useful.
For most students, the Screener is the only assessment used during the pilot.
- 06
The second assessment window
Approximately ninety days after the first administration, students take the Screener again during a normal class period.
Progress Rates are then available at the student, classroom, grade, and participating-cohort levels.
We review the second set of results with your team and compare them with the baseline from the beginning of the pilot.
AT THE END OF NINETY DAYS
What your school should be able to judge
The pilot is not only an opportunity to experience the assessments and reports. It is a structured way to decide whether greater Visibility would improve how your school understands and responds to students.
At the end of the pilot, your team should be able to consider:
- Did the assessments reveal important things about students we were not seeing clearly enough?
- Did item-level evidence or testing behavior change how we interpreted any concerning results?
- Did the findings help us identify students who needed closer attention or greater challenge?
- Did the second assessment add useful evidence about how students’ learning changed over time?
- Did the evidence improve the quality of conversations among teachers, specialists, and leaders?
- Would comprehensive Visibility strengthen the way our school knows students and follows their learning?
The decision about what comes next should be based on what your faculty learned from its own students.
Begin with the question you want the pilot to answer
Tell us what your school wants to understand more clearly. It may be the range of learning within a grade, students whose needs are not yet clear, whether high-achieving students are making enough progress, how well an intervention is working, or simply whether True Progress adds useful evidence to what your faculty already knows.
We will design the pilot around that question, the students who should participate, and the timing that fits your school calendar.